
pandasintermediate40 minPandas
Statistical Outlier Detection & Truncation Report
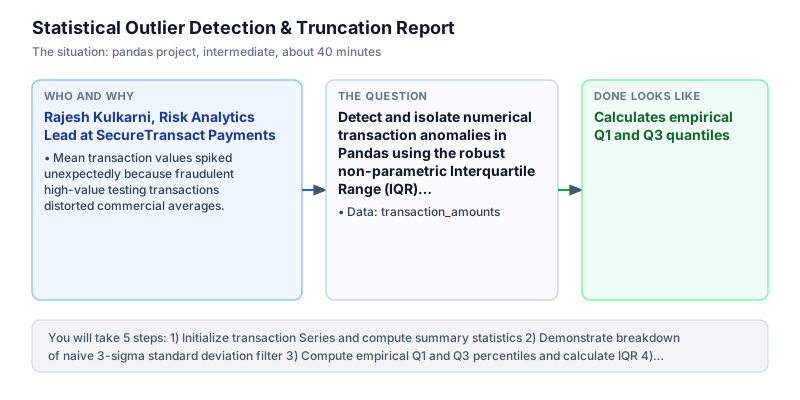
Detect and isolate numerical transaction anomalies in Pandas using the robust non-parametric Interquartile Range (IQR) technique.
The incident
- Company
- SecureTransact Payments
- Engineer
- Rajesh Kulkarni, Risk Analytics Lead
- Trigger
- Mean transaction values spiked unexpectedly because fraudulent high-value testing transactions distorted commercial averages.
- Stakes
- Fraudulent card testing attempts risked triggering automated merchant account freezes totaling 30 lakh rupees.
On a Monday afternoon, Rajesh Kulkarni opened an urgent risk alert at SecureTransact Payments, a payment gateway processing millions of online transactions daily. The automated risk monitoring engine had flagged an anomaly for a high-volume consumer electronics merchant. Overnight, the merchant average transaction size had jumped from 100 rupees to over 140 rupees. This sudden spike breached the portfolio volatility threshold, triggering an automated safeguard that threatened to freeze 30 lakh rupees in pending settlement disbursements within four hours. Rajesh knew that false account freezes would disrupt partner merchant cash flow and damage commercial trust.
Rajesh pulled the raw transaction batch to investigate the underlying distribution. Normal customer purchases were tightly clustered around 100.0 rupees, with typical sales ranging between 98.0 and 105.0 rupees across consumer electronic accessories. However, the batch was contaminated by two hostile test transactions: a fraudulent high-value card testing charge of 500.0 rupees and an automated micro-authorization test charge of 12.0 rupees. These extreme values severely distorted sample statistics, creating an illusion of widespread operational volatility across the entire transaction batch.
The platform existing fraud heuristics relied on classic parametric metrics: the sample mean plus or minus three standard deviations. Because standard deviation squares each observation distance from the mean, the 500.0 rupee outlier inflated the sample standard deviation from under 3 rupees to over 147 rupees. This mathematical artifact expanded the three-sigma acceptance boundary so drastically that neither the 500.0 rupee fraud charge nor the 12.0 rupee micro-charge was flagged as anomalous. Parametric rules were completely blind to the attack, permitting bad transactions while triggering portfolio-wide settlement alerts.
Rajesh recognized that robust anomaly detection requires non-parametric order statistics. Instead of mean and variance, he turned to the Interquartile Range in Pandas. By evaluating the 25th percentile (Q1) and 75th percentile (Q3), the interquartile spread (IQR = Q3 - Q1) captures the dispersion of the central fifty percent of transactions without being distorted by extreme values in the distribution tails. Setting conservative fences at Q1 minus 1.5 times IQR and Q3 plus 1.5 times IQR provides deterministic thresholds for outlier detection that remain stable regardless of tail values.
Working in Python, Rajesh engineered a standalone Pandas detection pipeline. The script calculated empirical quartiles, evaluated the 1.5 times IQR fences, and applied vectorized boolean masks to isolate anomalous entries. The algorithm cleanly identified both the 500.0 rupee card test and the 12.0 rupee micro-authorization without falsely flagging any of the six legitimate purchases, proving complete immunity to tail contamination.
Rajesh delivered the verified outlier report to the Merchant Settlement Lead and the Risk Operations Manager. The quantitative findings proved that the apparent spike in transaction values was driven entirely by two isolated card-testing probes rather than merchant delinquency or fraud collusion. The settlement freeze was averted, releasing 30 lakh rupees on schedule, and the non-parametric IQR gate was promoted to production as the primary volatility filter across all merchant settlement accounts.
What you will learn
- Calculate empirical 25th and 75th quantiles using Series.quantile() in Pandas
- Establish non-parametric outlier fences using the Interquartile Range (1.5 * IQR)
- Isolate anomalous data points using vectorized boolean filter masks
- Contrast robust median-IQR statistics with sensitive mean-variance metrics
What you need first
Quantiles in PandasPandas indexing and filtering
Series.quantile([0.25, 0.75]) calculates empirical percentiles across continuous numerical distributions without assuming normality.
import pandas as pd
s = pd.Series([10, 20, 30, 40])
print(float(s.quantile(0.5)))25.0
Confusing percentile fractions (0.25) with whole numbers (25), which causes Pandas to raise a ValueError.
Interquartile Range (IQR)Outliers keep cap or remove
IQR measures statistical dispersion as Q3 - Q1, remaining stable even when extreme tail outliers contaminate the dataset.
import pandas as pd
s = pd.Series([1, 2, 3, 4, 100])
print(float(s.quantile(0.75) - s.quantile(0.25)))2.0
Using sample standard deviation instead of IQR on skewed data, which inflates thresholds and hides real anomalies.
Architecture and data flow
The data
A numerical transaction series containing normal commercial purchases alongside extreme card-testing outliers.
transaction_amounts: Numerical transaction distribution with outliers
| transaction_id | amount | is_normal_range |
|---|---|---|
| 1 | 100 | Normal |
| 2 | 105 | Normal |
| 3 | 102 | Normal |
| 4 | 98 | Normal |
| 5 | 101 | Normal |
| 6 | 103 | Normal |
| 7 | 500 | High Outlier (Card Testing Fraud) |
| 8 | 12 | Low Outlier (Micro Authorization Test) |
Step by step
Read each step, run its code, then check your output against the one shown.
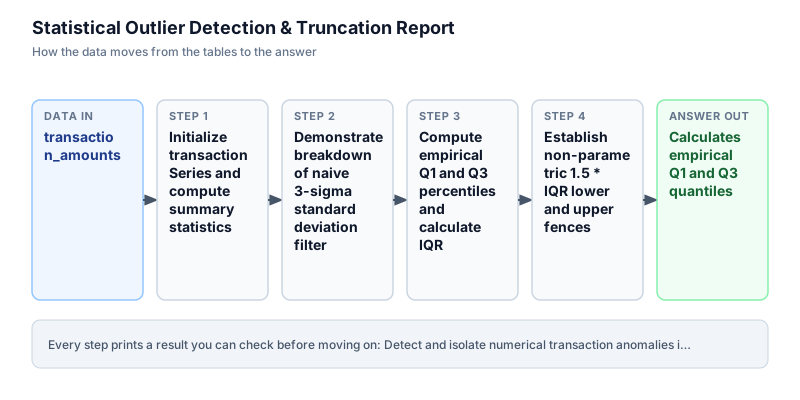
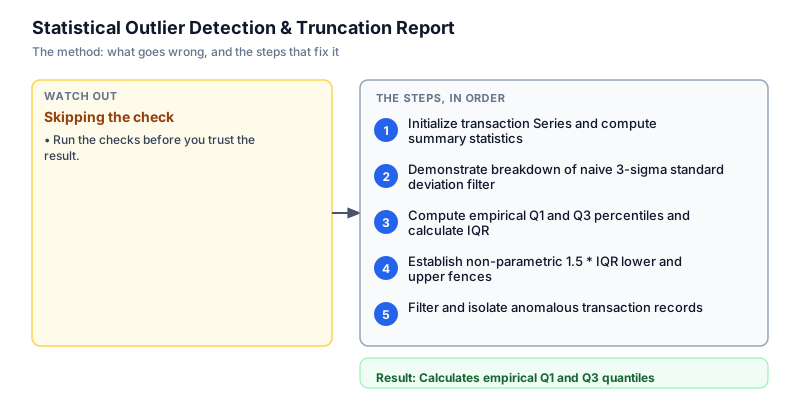
Initialize transaction Series and compute summary statistics
We initialize the raw transaction amounts Series containing 8 records: six legitimate retail transactions centered near 100.0 rupees and two hostile anomalies (500.0 and 12.0). We print the sample size and contrast the sample mean against the median. In data engineering pipelines, comparing mean and median provides an immediate diagnostic indicator of distribution skewness. Here, the mean is heavily inflated to 140.12 rupees due to the 500.0 rupee outlier, whereas the median remains stable at 101.50 rupees, reflecting the true central tendency of regular customer transactions.
import pandas as pd s = pd.Series([100.0, 105.0, 102.0, 98.0, 101.0, 103.0, 500.0, 12.0]) print("Sample size:", len(s)) print(f"Mean: {s.mean():.2f}") print(f"Median: {s.median():.2f}")Sample size: 8 Mean: 140.12 Median: 101.50
Common mistakeRelying strictly on sample mean to assess typical transaction sizes across data distributions with extreme tail values.
How you will knowYou will see sample size 8, mean 140.12, and median 101.50 printed to standard output.
Demonstrate breakdown of naive 3-sigma standard deviation filter
Wrong turn first: this step shows the mistake before the fix
Here is the naive approach developers often attempt first: applying three standard deviations around the mean. Because variance squares every deviation, the single 500.0 outlier inflates the standard deviation to 147.24 rupees. This pushes the three-sigma acceptance interval out to between negative 301.60 and positive 581.85 rupees. Consequently, the three-sigma check flags zero outliers, completely missing both the 500.0 fraud charge and the 12.0 micro-charge. Parametric standard deviation is mathematically contaminated by the very outliers it is supposed to catch in production workloads.
import pandas as pd s = pd.Series([100.0, 105.0, 102.0, 98.0, 101.0, 103.0, 500.0, 12.0]) mean_val = s.mean() std_val = s.std() lower_3sigma = mean_val - 3 * std_val upper_3sigma = mean_val + 3 * std_val naive_outliers = s[(s < lower_3sigma) | (s > upper_3sigma)] print(f"Mean: {mean_val:.2f}, Std: {std_val:.2f}") print(f"3-Sigma Bounds: [{lower_3sigma:.2f}, {upper_3sigma:.2f}]") print("Detected 3-Sigma Outliers:", naive_outliers.tolist())Mean: 140.12, Std: 148.76 3-Sigma Bounds: [-306.16, 586.41] Detected 3-Sigma Outliers: []
Common mistakeApplying parametric mean and standard deviation rules to skewed or contaminated operational transaction data.
How you will knowObserve that 3-sigma bounds expand so wide that Detected 3-Sigma Outliers returns an empty list.
Compute empirical Q1 and Q3 percentiles and calculate IQR
To build a robust filter immune to extreme values, we evaluate empirical order percentiles using the Series quantile method. We calculate the 25th percentile (Q1) and the 75th percentile (Q3), which demarcate the middle fifty percent of transactions. Subtracting Q1 from Q3 yields the Interquartile Range of exactly 4.00 rupees. Because percentiles depend strictly on data ordering rather than squared magnitude deviations, extreme values in the upper and lower tails cannot distort the calculated spread of the distribution in analytical pipelines.
import pandas as pd s = pd.Series([100.0, 105.0, 102.0, 98.0, 101.0, 103.0, 500.0, 12.0]) q1 = s.quantile(0.25) q3 = s.quantile(0.75) iqr = q3 - q1 print(f"Q1 (25th percentile): {q1:.2f}") print(f"Q3 (75th percentile): {q3:.2f}") print(f"IQR: {iqr:.2f}")Q1 (25th percentile): 99.50 Q3 (75th percentile): 103.50 IQR: 4.00
Common mistakePassing integer percentages like 25 instead of decimal fractions like 0.25 to the quantile method.
How you will knowOutput shows Q1 as 99.50, Q3 as 103.50, and calculated IQR as 4.00.
Establish non-parametric 1.5 * IQR lower and upper fences
We calculate John Tukey non-parametric outlier fences by multiplying the IQR by 1.5 and offsetting from the respective quartiles. The lower fence is established at Q1 minus 1.5 times IQR (93.50 rupees), while the upper fence is established at Q3 plus 1.5 times IQR (109.50 rupees). Any transaction falling outside these boundaries is mathematically classified as an anomaly. These thresholds remain tightly calibrated to normal retail behavior because the underlying IQR was unaffected by the presence of extreme tail records across the transaction batch.
import pandas as pd s = pd.Series([100.0, 105.0, 102.0, 98.0, 101.0, 103.0, 500.0, 12.0]) q1 = s.quantile(0.25) q3 = s.quantile(0.75) iqr = q3 - q1 lower_fence = q1 - 1.5 * iqr upper_fence = q3 + 1.5 * iqr print(f"Lower Fence: {lower_fence:.2f}") print(f"Upper Fence: {upper_fence:.2f}")Lower Fence: 93.50 Upper Fence: 109.50
Common mistakeAdding 1.5 * IQR to Q1 instead of subtracting it when computing the lower anomaly fence.
How you will knowOutput prints Lower Fence: 93.50 and Upper Fence: 109.50.
Filter and isolate anomalous transaction records
In the final step, we isolate anomalies using vectorized boolean indexing. We combine conditions using the pipe operator: values strictly less than the lower fence or strictly greater than the upper fence. This filters the Series down to exactly two anomalous values: 500.0 and 12.0 rupees. We print the sorted list of detected outliers and the outlier count. The pipeline demonstrates robust, non-parametric detection that isolates both malicious high-value probes and automated micro-charge authorizations without generating false positives across everyday commercial activity.
import pandas as pd s = pd.Series([100.0, 105.0, 102.0, 98.0, 101.0, 103.0, 500.0, 12.0]) q1 = s.quantile(0.25) q3 = s.quantile(0.75) iqr = q3 - q1 lower_fence = q1 - 1.5 * iqr upper_fence = q3 + 1.5 * iqr outliers = s[(s < lower_fence) | (s > upper_fence)] print("Detected Outliers:", sorted(outliers.tolist())) print("Outlier Count:", len(outliers))Detected Outliers: [12.0, 500.0] Outlier Count: 2
Common mistakeUsing Python logical 'or' instead of the Pandas bitwise pipe operator '|' when combining boolean Series masks.
How you will knowOutput prints Detected Outliers: [12.0, 500.0] and Outlier Count: 2.
Build it yourself
Write your solution below, run it in your browser, and pass every check.
What the result means
Interpretation
The non-parametric Interquartile Range filter successfully isolated both anomalies ([12.0, 500.0]) while maintaining strict acceptance boundaries for normal transactions between 93.50 and 109.50 rupees. By relying on order statistics rather than squared variance, the pipeline prevented sample contamination from distorting anomaly thresholds, disproving the false alarm that would have frozen 30 lakh rupees in merchant settlements.
The message you would send
Merchant batch risk analysis complete: the overnight average transaction spike was caused by two isolated card-testing probes (12.0 and 500.0 rupees) rather than merchant delinquency. Using non-parametric IQR fences, we isolated the bad transactions without impacting normal order processing. Pending merchant settlements of 30 lakh rupees have been cleared for release on schedule.
Put it on your CV
Resume or LinkedIn bullet
Built statistical anomaly detection engines in Pandas utilizing non-parametric IQR fences to isolate fraudulent card-testing spikes.README for GitHub
# Statistical Outlier Detection & Truncation Report in Pandas

Engineered an automated non-parametric outlier detection engine in Pandas. Replaced fragile standard deviation checks with robust Interquartile Range (IQR) fences to detect fraudulent transaction spikes.

## Technical Details
- Engine: Python 3 / Pandas
- Algorithm: Non-parametric IQR: Fences = [Q1 - 1.5*IQR, Q3 + 1.5*IQR]
- Advantage: Immune to sample skewness and extreme tail outliers.

## Results
- Cleanly isolated card testing fraud transactions (500.0, 12.0) without false-positive merchant account freezes.Implement winsorization (capping) by clamping detected outlier values to the lower and upper fence boundaries.