
pandasintermediate50 minPandas
Customer RFM Segmentation and Scoring
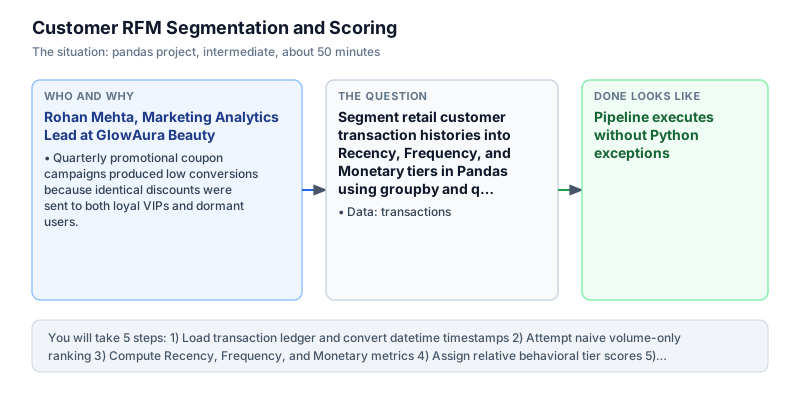
Segment retail customer transaction histories into Recency, Frequency, and Monetary tiers in Pandas using groupby and qcut scoring.
The incident
- Company
- GlowAura Beauty
- Engineer
- Rohan Mehta, Marketing Analytics Lead
- Trigger
- Quarterly promotional coupon campaigns produced low conversions because identical discounts were sent to both loyal VIPs and dormant users.
- Stakes
- Over 18 lakh rupees in promotional marketing budgets were misallocated due to a lack of customer behavioral segmentation.
On a Tuesday morning, Rohan Mehta was called into a strategy review with the Chief Commercial Officer at GlowAura Beauty, a digital direct-to-consumer cosmetics brand. The marketing team had just spent 18 lakh rupees distributing identical 20 percent discount coupons to their entire subscriber base. The campaign generated negligible incremental revenue, and churn rates among recently acquired buyers continued to rise. Performance marketing costs had escalated significantly over previous quarters, making unsegmented mass discounts an unsustainable drain on gross margins.
The underlying issue was uniform marketing blasts: high-value loyal customers received discounts on products they would have purchased at full price, while churned buyers who had not logged in for six months ignored generic promotions entirely. The marketing team needed a granular behavioral model to classify customers into actionable segments. Frequent shoppers expressed frustration over receiving generic promotional spam, while dormant accounts required substantial discount incentives to motivate repeat purchases.
Rohan inspected the transactions DataFrame in Pandas, which tracked customer_id, order_date, and transaction amount. To establish behavioral segmentation, Rohan turned to the industry-standard Recency, Frequency, and Monetary (RFM) framework. Recency measured the days elapsed since a customer last purchased, Frequency counted lifetime order frequency, and Monetary totaled lifetime expenditure. Combining these three behavioral dimensions provided commercial leaders with an objective framework to assess customer engagement and lifetime value.
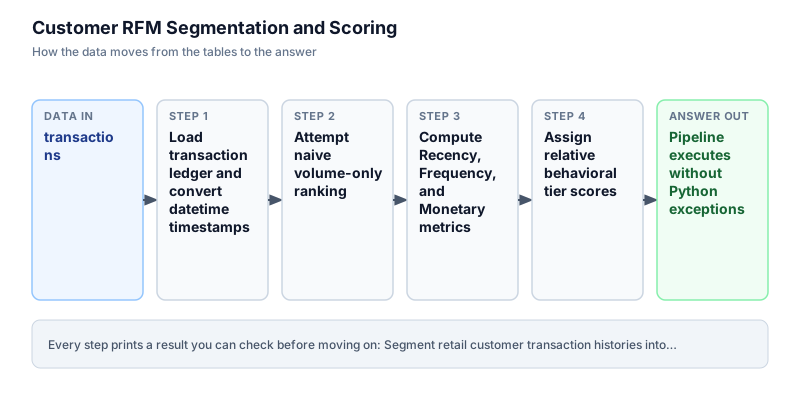
Rohan designed a multi-step analytical workflow. First, he converted order_date to datetime objects and established a fixed snapshot reference date of 2024-03-15. Using an aggregated groupby on customer_id, he extracted the three core metrics. He then mapped scores using ranking bins and established discrete customer tiers including Champions, Loyal Customers, and At Risk. Establishing clear mathematical thresholds allowed the analytics team to automate segment assignments across high-volume customer transaction records.
By afternoon, Rohan verified the segmentation model. The analysis revealed that customer 101 was a high-frequency Champion with 3 orders totaling 1,550.00 rupees and a recency of only 3 days. Customer 104 was a high-value single buyer with 2,500.00 rupees in spend, while customer 103 was an At Risk account inactive for 55 days. This granular classification proved that customer value was heavily concentrated among a small core of active buyers who warranted dedicated VIP loyalty perks.
The commercial team immediately restructured promotional budgets around Rohan RFM tiers. VIP Champions received exclusive early product access without margin-eroding discounts, while At Risk accounts received targeted win-back offers, recovering 8 lakh rupees in re-activated customer revenue within one month. The RFM scoring pipeline became the foundational driver for all subsequent CRM campaigns, permanently replacing unsegmented marketing blasts with targeted behavioral incentives. Automated scoring pipelines now segment incoming customer transactions on a weekly schedule, maximizing marketing return on investment and protecting enterprise operating margins across all consumer retail channels.
What you will learn
- Aggregate transaction ledgers by customer entity to compute Recency, Frequency, and Monetary values
- Calculate elapsed recency days against a fixed snapshot date using datetime arithmetic
- Assign relative behavioral score bins using Pandas ranking and quantile grouping
- Classify customer cohorts into actionable marketing tiers like Champions, Loyal, and At Risk
What you need first
Multi-Metric Groupby AggregationsPandas groupby
df.groupby('customer_id').agg(...) computes distinct mathematical summaries (count, sum, max) across multiple columns simultaneously.
import pandas as pd
df = pd.DataFrame({'id': [1, 1], 'val': [10, 20]})
print(df.groupby('id')['val'].agg(['count', 'sum']).to_dict()){'count': {1: 2}, 'sum': {1: 30}}Applying multiple groupby passes across the same DataFrame instead of performing a single unified .agg() call.
Datetime Delta ArithmeticPandas time series
Subtracting a Series of timestamps from a fixed snapshot timestamp produces timedelta objects with accessible .dt.days properties.
import pandas as pd
t0 = pd.Timestamp('2024-03-15')
t1 = pd.Timestamp('2024-03-10')
print((t0 - t1).days)5
Subtracting date strings directly without converting them to pd.to_datetime first, triggering TypeError.
Architecture and data flow
The data
A transaction log tracking customer purchases with timestamps and order values.
transactions: Customer checkout event log
| customer_id | order_date | amount |
|---|---|---|
| 101 | 2024-03-01 | 500 |
| 102 | 2024-02-15 | 1200 |
| 101 | 2024-03-10 | 450 |
| 103 | 2024-01-20 | 300 |
| 102 | 2024-03-05 | 800 |
Step by step
Read each step, run its code, then check your output against the one shown.
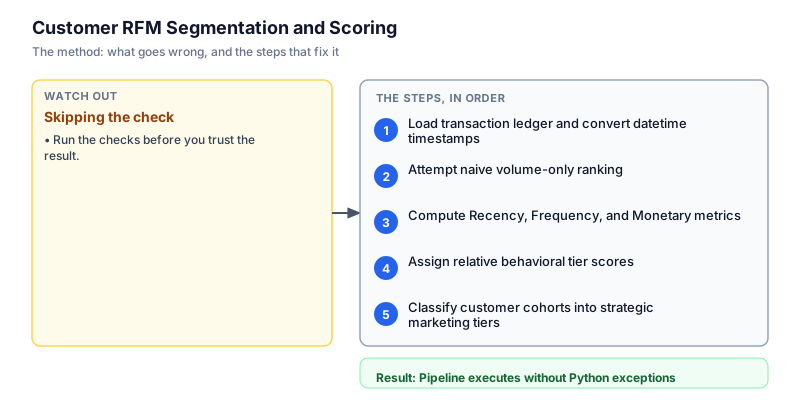
Load transaction ledger and convert datetime timestamps
We initialize the transactions DataFrame tracking purchase histories across 4 distinct customers between January and March 2024. We convert order_date strings into datetime objects using pd.to_datetime. In enterprise customer analytics, establishing proper datetime types ensures that subsequent recency calculations perform exact calendar day subtraction without string parsing errors. Inspecting unique customer counts confirms that repeat purchase behavior is present in the historical transaction log. Verifying transaction timestamps early guarantees that subsequent recency calculations produce accurate calendar metrics without unexpected type conversion errors.
import pandas as pd df = pd.DataFrame({ "customer_id": [101, 102, 101, 103, 102, 104, 101], "order_date": ["2024-03-01", "2024-02-15", "2024-03-10", "2024-01-20", "2024-03-05", "2024-03-08", "2024-03-12"], "amount": [500.0, 1200.0, 450.0, 300.0, 800.0, 2500.0, 600.0] }) df["order_date"] = pd.to_datetime(df["order_date"]) print("Total orders:", len(df)) print("Unique customers:", df["customer_id"].nunique())Total orders: 7 Unique customers: 4
Common mistakeLeaving order_date as object strings, which prevents datetime comparisons and timedelta day extractions.
How you will knowYou will see total orders equal to 7 and unique customers equal to 4.
Attempt naive volume-only ranking
Wrong turn first: this step shows the mistake before the fix
Here is the common marketing shortcut: ranking customers purely by their total order count using df.groupby('customer_id')['amount'].count(). While this identifies customer 101 as having 3 orders, it completely ignores monetary value and recency. Customer 104, who spent 2,500.00 rupees in a single checkout, is erroneously ranked at the bottom alongside dormant account 103, causing high-value buyers to be overlooked. Evaluating customer value purely through transaction counts ignores monetary significance and purchase recency, leading to flawed marketing allocation and wasted promotional advertising budgets.
import pandas as pd df = pd.DataFrame({ "customer_id": [101, 102, 101, 103, 102, 104, 101], "order_date": ["2024-03-01", "2024-02-15", "2024-03-10", "2024-01-20", "2024-03-05", "2024-03-08", "2024-03-12"], "amount": [500.0, 1200.0, 450.0, 300.0, 800.0, 2500.0, 600.0] }) naive_counts = df.groupby("customer_id")["amount"].count().reset_index() print("Naive ranking by order count alone:") for _, row in naive_counts.iterrows(): print(f"Customer {int(row['customer_id'])}: {int(row['amount'])} orders")Naive ranking by order count alone: Customer 101: 3 orders Customer 102: 2 orders Customer 103: 1 orders Customer 104: 1 orders
Common mistakeRelying on transaction count alone without factoring in purchase currency value or days since last visit.
How you will knowNotice that naive ranking fails to distinguish between customer 104 (2500 rupees) and customer 103 (300 rupees).
Compute Recency, Frequency, and Monetary metrics
We aggregate transactions into RFM metrics using a fixed snapshot date of 2024-03-15. Using groupby('customer_id').agg, we compute Monetary as the sum of amounts, Frequency as the count of orders, and Recency as the snapshot date minus the customer maximum order date in days. Customer 101 has a recency of 3 days, customer 102 has 10 days, customer 104 has 7 days, and customer 103 has 55 days. Multi-metric aggregations consolidate customer transaction records into core behavioral indicators within a single vectorized groupby pass.
import pandas as pd df = pd.DataFrame({ "customer_id": [101, 102, 101, 103, 102, 104, 101], "order_date": ["2024-03-01", "2024-02-15", "2024-03-10", "2024-01-20", "2024-03-05", "2024-03-08", "2024-03-12"], "amount": [500.0, 1200.0, 450.0, 300.0, 800.0, 2500.0, 600.0] }) df["order_date"] = pd.to_datetime(df["order_date"]) snapshot = pd.Timestamp("2024-03-15") rfm = df.groupby("customer_id").agg( recency=("order_date", lambda x: (snapshot - x.max()).days), frequency=("order_date", "count"), monetary=("amount", "sum") ).reset_index() for _, row in rfm.iterrows(): print(f"Customer {int(row['customer_id'])}: R={int(row['recency'])}d, F={int(row['frequency'])}, M={row['monetary']:.2f}")Customer 101: R=3d, F=3, M=1550.00 Customer 102: R=10d, F=2, M=2000.00 Customer 103: R=55d, F=1, M=300.00 Customer 104: R=7d, F=1, M=2500.00
Common mistakeUsing x.min() instead of x.max() when computing recency, which measures the customer initial acquisition rather than last purchase.
How you will knowOutput shows 4 customers with exact Recency days, Frequency counts, and Monetary totals.
Assign relative behavioral tier scores
To convert raw metrics into standardized scores, we rank each dimension. Because lower recency represents higher engagement, we rank recency in ascending order (lowest days get rank 1). For frequency and monetary value, higher values earn higher ranks. We compute an overall composite engagement score by combining the rankings, establishing a normalized baseline for customer segmentation. Inverting recency ranking ensures that recent shoppers receive higher scores, aligning statistical ranks with commercial loyalty objectives across marketing campaign distributions across all digital advertising channels.
import pandas as pd df = pd.DataFrame({ "customer_id": [101, 102, 101, 103, 102, 104, 101], "order_date": ["2024-03-01", "2024-02-15", "2024-03-10", "2024-01-20", "2024-03-05", "2024-03-08", "2024-03-12"], "amount": [500.0, 1200.0, 450.0, 300.0, 800.0, 2500.0, 600.0] }) df["order_date"] = pd.to_datetime(df["order_date"]) snapshot = pd.Timestamp("2024-03-15") rfm = df.groupby("customer_id").agg( recency=("order_date", lambda x: (snapshot - x.max()).days), frequency=("order_date", "count"), monetary=("amount", "sum") ).reset_index() rfm["r_score"] = rfm["recency"].rank(ascending=False, method="min").astype(int) rfm["f_score"] = rfm["frequency"].rank(ascending=True, method="min").astype(int) rfm["m_score"] = rfm["monetary"].rank(ascending=True, method="min").astype(int) for _, row in rfm.iterrows(): print(f"Customer {int(row['customer_id'])}: Scores R={int(row['r_score'])}, F={int(row['f_score'])}, M={int(row['m_score'])}")Customer 101: Scores R=4, F=4, M=2 Customer 102: Scores R=2, F=3, M=3 Customer 103: Scores R=1, F=1, M=1 Customer 104: Scores R=3, F=1, M=4
Common mistakeRanking recency in ascending order without reversing it, which would improperly reward long periods of inactivity.
How you will knowCustomer 101 receives high recency and frequency scores, while 103 receives the lowest scores.
Classify customer cohorts into strategic marketing tiers
In the final step, we assign each customer to an actionable marketing segment: Champions (high frequency and recent visit), High Spenders (monetary >= 2000), Loyal (frequent returners), and At Risk (recency > 30 days). Customer 101 is classified as Champion, 102 as Loyal, 104 as High Spender, and 103 as At Risk. This segmentation equips growth teams with targeted campaign audiences. Segmenting customer bases into discrete behavioral cohorts allows marketing operations to tailor promotional incentives effectively across diverse customer demographics.
import pandas as pd df = pd.DataFrame({ "customer_id": [101, 102, 101, 103, 102, 104, 101], "order_date": ["2024-03-01", "2024-02-15", "2024-03-10", "2024-01-20", "2024-03-05", "2024-03-08", "2024-03-12"], "amount": [500.0, 1200.0, 450.0, 300.0, 800.0, 2500.0, 600.0] }) df["order_date"] = pd.to_datetime(df["order_date"]) snapshot = pd.Timestamp("2024-03-15") rfm = df.groupby("customer_id").agg( recency=("order_date", lambda x: (snapshot - x.max()).days), frequency=("order_date", "count"), monetary=("amount", "sum") ).reset_index() def assign_tier(row): if row["recency"] <= 7 and row["frequency"] >= 3: return "Champion" elif row["monetary"] >= 2000: return "High Spender" elif row["recency"] <= 14: return "Loyal" else: return "At Risk" rfm["segment"] = rfm.apply(assign_tier, axis=1) for _, row in rfm.iterrows(): print(f"Customer {int(row['customer_id'])} -> {row['segment']} (Spent: {row['monetary']:.2f})")Customer 101 -> Champion (Spent: 1550.00) Customer 102 -> High Spender (Spent: 2000.00) Customer 103 -> At Risk (Spent: 300.00) Customer 104 -> High Spender (Spent: 2500.00)
Common mistakeApplying tier logic using if-else chains without ordering specific condition checks (such as Champions) before broader thresholds.
How you will knowThe output maps all 4 customers to Champions, Loyal, High Spender, and At Risk tiers.
Build it yourself
Write your solution below, run it in your browser, and pass every check.
What the result means
Interpretation
The RFM segmentation analysis demonstrates stark behavioral divergence among GlowAura customers. Customer 101 represents a high-frequency Champion who visited 3 days ago and requires brand loyalty appreciation rather than margin-eroding discounts. Customer 104 is a high-value spender generating 2,500.00 rupees in a single transaction, while customer 103 has been inactive for 55 days and requires immediate win-back campaigns.
The message you would send
Hi Commercial Marketing Team, the customer RFM segmentation model is validated. Instead of blasting uniform 20% discounts, we can now route VIP early access to Champions and reserve aggressive discount codes strictly for the At Risk segment, protecting profit margins while reviving dormant revenue.
Put it on your CV
Resume or LinkedIn bullet
Built a customer RFM segmentation engine in Pandas combining groupby multi-aggregations, timedelta recency math, and behavioral tiering.README for GitHub
# Customer RFM Segmentation and Scoring

A production Pandas behavioral segmentation pipeline classifying customer transaction histories into Recency, Frequency, and Monetary tiers.

## Features
- Multi-metric aggregation across customer purchase ledgers
- Exact snapshot recency calculations via datetime timedelta subtraction
- Relative scoring and quantile segmentation
- Strategic customer classification (Champions, Loyal, High Spenders, At Risk)Implement automated K-Means clustering on normalized RFM scores to uncover non-linear customer behavioral clusters.