
Overview
Reports usually ask for a value per group. Learn groupby and named aggregations, then use transform when the group result must stay beside every original row.
On this page8 sections
The table we keep using
A manager does not want to read 180 order rows. They want one line per status: how many orders and how much money.
Split the orders by status, add up each group, and put the results together. That is groupby.
What does 1 row per order look like?
We start with a 5-order sample from the ShopKart dataset. Each row is one order, and the table is a list of single purchases.
5 rows, one per order. Three are paid.
| order_id | order_status | order_total |
|---|---|---|
| ORD-0001 | paid | 612.07 |
| ORD-0002 | refunded | 446.70 |
| ORD-0003 | paid | 1104.32 |
| ORD-0004 | cancelled | 339.90 |
| ORD-0005 | paid | 261.73 |
Nobody reads 180 of these. A manager wants one line per status. That is a groupby.
What are split, apply and combine?
Grouping is three moves. Split the rows into piles that share a key, reduce each pile to 1 row, then stack those rows into a summary.
Rows are split by status, each group is reduced to one summary row, and the results are combined.
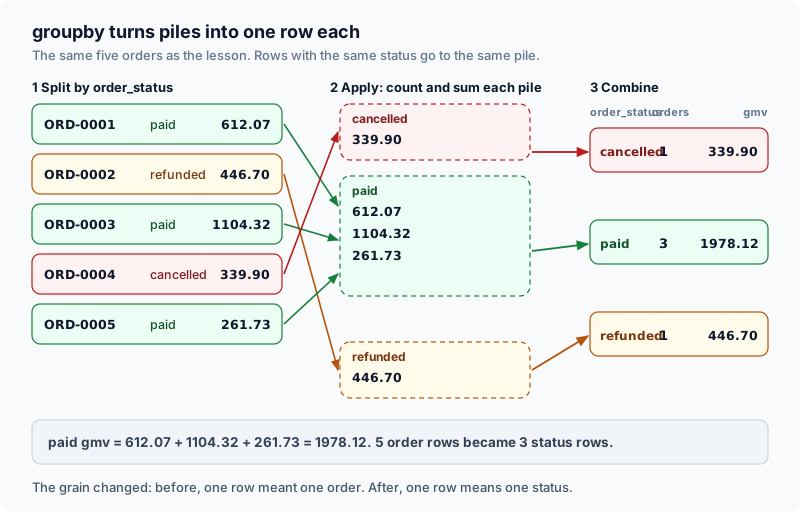
groupby splits the rows, reduces each pile, and stacks the results.
Words you will see in this lesson
Six words. The rest of the lesson uses only these.
| Word | What it means |
|---|---|
| groupby | Split rows into groups by a column |
| Aggregate | Combine many rows into one number |
| Split | Cut the rows into groups |
| Grain | What one row stands for |
| agg | Run several aggregates at once |
| Index | The label on each row |
What we need from it
Which questions are really group questions?
Business questions are almost always about groups: revenue per category, orders per country, average order value per status.
Same key, three different calculations.
| Question | Group by | Calculation |
|---|---|---|
| How many orders in each status? | order_status | count of order_id |
| How much money in each status? | order_status | sum of order_total |
| What is the average order per status? | order_status | mean of order_total |
Without groupby you would filter for each status by hand and repeat the sums. The same idea is SQL's GROUP BY.
What happens to the grain?
Grain is what 1 row stands for. Before grouping, a row is one order. After, a row is one status.
- 180 rows, one per order
- groupby order_status
- 4 rows, one per status
Counting rows after a bad join, or after a hidden filter, gives numbers that look right and are wrong. So name the grain first.
Trace it step by step
Step 1: what is the output grain?
Finish this sentence before writing code: I want one output row per ___. The blank is your groupby key.
For 1 row per status, the key is order_status. For 1 row per status and size, the key is both columns.
Step 2: what does the split look like?
groupby does not compute anything yet. It sorts the rows into piles. Loop over it to see the piles.
first5 = df_orders.head(5)[["order_id", "order_status", "order_total"]]
for key, pile in first5.groupby("order_status"):
print(key, pile["order_total"].tolist())cancelled [339.9] paid [612.07, 1104.32, 261.73] refunded [446.7]
Three statuses, three piles, sorted by key name. The paid pile holds 3 orders.
Step 3: how do you reduce each pile?
.agg(...) says what to compute per pile. Each argument is name=(column, function), which is called named aggregation.
r5 = first5.groupby("order_status", as_index=False).agg(
    orders=("order_id", "count"),
    gmv=("order_total", "sum"),
)
print(r5)order_status orders gmv 0 cancelled 1 339.90 1 paid 3 1978.12 2 refunded 1 446.70
Paid is 612.07 plus 1104.32 plus 261.73, which is 1978.12. 5 rows became three.
Step 4: what does the same code do on all 180 orders?
Swap first5 for df_orders and nothing else changes. That is the point of groupby.
result = df_orders.groupby("order_status", as_index=False).agg(
    orders=("order_id", "count"),
    gmv=("order_total", "sum"),
)
print(result)order_status orders gmv 0 cancelled 30 11248.61 1 paid 93 43606.63 2 pending 29 14478.51 3 refunded 28 14082.40
4 rows, one per status. The order counts add up to 180.
Why as_index=False?
By default, groupby moves the key into the row labels. as_index=False keeps it as a normal column.
d = df_orders.groupby("order_status").agg(
    orders=("order_id", "count"),
    gmv=("order_total", "sum"),
)
print(d)
print(d.columns.tolist())orders gmv order_status cancelled 30 11248.61 paid 93 43606.63 pending 29 14478.51 refunded 28 14082.40 ['orders', 'gmv']
order_status is now the index, not a column, so it is missing from the column list. Use as_index=False when the next step needs it as a column, such as a merge or the grader.
Why named aggregation?
The older way is to pass a dictionary. It works, but the column names come out in 2 layers.
m = df_orders.groupby("order_status").agg({"order_total": ["count", "sum"]})
print(m.columns.tolist())[('order_total', 'count'), ('order_total', 'sum')]Each column name is a pair, which is awkward to select. Named aggregation gives flat names like orders and gmv.
Use output_name=(column, function). You get flat, readable column names.
Is count the same as the number of rows?
Not always. count skips missing values, and size counts every row. Blank out one refunded total and compare.
tmp = first5.copy()
tmp.loc[1, "order_total"] = np.nan
check = tmp.groupby("order_status").agg(
    rows=("order_id", "size"),
    counted=("order_total", "count"),
    total=("order_total", "sum"),
)
print(check)rows counted total order_status cancelled 1 1 339.90 paid 3 3 1978.12 refunded 1 0 0.00
The refunded pile has 1 row but no counted values. Its sum is 0.00, because sum skips blanks. Count a column that is never blank, like order_id, or use size.
The common aggregations and what they do with blanks.
| Aggregation | Meaning | Null behavior |
|---|---|---|
| size | Rows in each group | Counts every row, including nulls |
| count | Non-null values in the column | Skips nulls |
| sum | Total numeric value | Skips nulls by default |
| mean | Average numeric value | Skips nulls by default |
| nunique | Count of distinct values | Skips nulls by default |
| min / max | Smallest / largest value | Skips nulls by default |
count('order_total') counts non-null values in that column. If some totals are NaN, count will be lower than the actual group size. Use 'size' or count a guaranteed non-null column like order_id.
Same table, next cut
What if the grain needs 2 keys?
Pass a list to groupby for a finer grain. Here we split every status into big and small orders, with 400 as the cut.
size = np.where(df_orders["order_total"] >= 400, "big", "small")
by_status_size = (
    df_orders.assign(size=size)
    .groupby(["order_status", "size"], as_index=False)
    .agg(orders=("order_id", "count"), gmv=("order_total", "sum"))
    .sort_values(["gmv", "order_status"], ascending=[False, True])
)
print(by_status_size)order_status size orders gmv 2 paid big 49 35104.28 4 pending big 14 11113.54 6 refunded big 15 10760.57 3 paid small 44 8502.35 0 cancelled big 12 7994.76 5 pending small 15 3364.97 7 refunded small 13 3321.83 1 cancelled small 18 3253.85
8 rows: four statuses times two sizes. The original index labels (2, 4, 6...) stay with their rows after the sort.
What if every row needs its group total?
agg shrinks the table. transform keeps every row and pastes the group result onto each one. Use it for a share of the group.
status_gmv = first5.groupby("order_status")["order_total"].transform("sum")
print(status_gmv.tolist())[1978.1200000000001, 446.7, 1978.1200000000001, 339.9, 1978.1200000000001]
5 values for 5 rows. The three paid rows all carry 1978.12 (plus a tiny float rounding tail). Now divide.
shares = first5.assign(
    status_gmv=status_gmv,
    share=lambda d: (d["order_total"] / d["status_gmv"]).round(4),
)
print(shares)order_id order_status order_total status_gmv share 0 ORD-0001 paid 612.07 1978.12 0.3094 1 ORD-0002 refunded 446.70 446.70 1.0000 2 ORD-0003 paid 1104.32 1978.12 0.5583 3 ORD-0004 cancelled 339.90 339.90 1.0000 4 ORD-0005 paid 261.73 1978.12 0.1323
ORD-0001, ORD-0003 and ORD-0005 add up to 100 percent of the 1978.12 paid total.
Refunded and cancelled have only one order each, so each holds 100 percent of its group.
agg reduces rows (one per group). transform keeps all original rows and broadcasts the group result. Use transform when you need a group metric alongside each detail row.
How do you know the grouping is right?
After groupby, check that the keys are unique and the group totals add back to the source total.
print(round(result["gmv"].sum() - df_orders["order_total"].sum(), 6))
print(result["order_status"].is_unique)
print(result["orders"].sum() == len(df_orders))0.0 True True
Zero difference, 1 row per key, and every order counted once. A check that fails points to a missing category or a hidden filter.
What happens to rows with a missing key?
By default, groupby drops them without a word. A reconcile check is what catches this.
t2 = pd.DataFrame({"s": ["a", "a", None], "v": [1, 2, 3]})
print(t2.groupby("s")["v"].sum())
print(t2.groupby("s", dropna=False)["v"].sum())s a 3 Name: v, dtype: int64 s a 3 NaN 3 Name: v, dtype: int64
The default total is 3 and the third row is gone. With dropna=False the missing key becomes a group of its own, so nothing vanishes.
How does this look in SQL?
SELECT status, COUNT(*) AS orders, SUM(total) AS gmv FROM orders GROUP BY status is exactly df.groupby('status', as_index=False).agg(orders=('order_id', 'count'), gmv=('total', 'sum')). Same grain rules, different syntax.
If you already think in SQL, translate the clauses one at a time: GROUP BY becomes the groupby key, each aggregate in SELECT becomes one named aggregation, and the alias after AS becomes the left-hand name.
How does the whole trace replay?
Name the grain. 1 row per status, so the key is order_status.
- grain
- order_status
Split. The 5 orders fall into three piles: cancelled, paid, refunded.
- 5 rows
- 3 piles
Apply and combine with named aggregation. Paid becomes 3 orders, 1978.12.
- agg
- 3 rows
Use transform when every order needs its group total. ORD-0001 is 0.3094 of paid.
- transform
- share
Reconcile. The summary adds back to 83416.15 and 180 orders.
- gmv sum
- matches source
Five things to know from this lesson:
- State the output grain before writing groupby.
- Use named aggregation, name=(column, function), for flat column names.
- count skips blanks and size does not. Count order_id when you want rows.
- Use transform when every source row needs its group metric, agg when you want 1 row per group.
- Reconcile: keys are unique, and the group totals add back to the source total.
Common beginner questions
What is the difference between agg and transform?
agg produces one summary row per group (reduces rows). transform pastes the group result back onto every original row (preserves row count). Use agg for summaries and transform for row-level enrichment.
Why use as_index=False?
By default, groupby makes the group keys the DataFrame index. as_index=False keeps them as regular columns, which is usually easier to work with and avoids confusion.
Can I group by more than 2 columns?
Yes. Pass a list of any number of columns. Each unique combination of values across those columns becomes one group.
What comes next
Now that you can summarize data by groups, the next lesson covers combining DataFrames: merging (joining) 2 tables on a shared key, stacking frames with concat, and understanding how joins can change your row count.
Practice
Group df_orders by order_status with as_index=False. Name the count of order_id as 'orders' and the sum of order_total as 'gmv'.
Assign the summary DataFrame to result. The expected grain is exactly 1 row per order status.
Going further: size or count, and a share of the total
size and count look the same until a value is missing: size counts rows, count counts non-missing values. Then transform answers 'what share of its group is this row' without losing any rows. Predict the three numbers for group A.
import pandas as pd

df = pd.DataFrame({
    "region": ["A", "A", "A", "B"],
    "amount": [100.0, None, 50.0, 70.0],
})

print(df.groupby("region")["amount"].size().to_dict())
print(df.groupby("region")["amount"].count().to_dict())

df["share"] = df["amount"] / df.groupby("region")["amount"].transform("sum")
print(df){'A': 3, 'B': 1}
{'A': 2, 'B': 1}
region amount share
0 A 100.0 0.666667
1 A NaN NaN
2 A 50.0 0.333333
3 B 70.0 1.000000Region A has 3 rows but only 2 amounts, so size is 3 and count is 2.
Use size for 'how many rows' and count for 'how many values are present'. transform('sum') returns a column the same length as the table, so each row can be divided by its own group's total: 100 / 150 and 50 / 150. The missing amount stays missing.
Try a new scenario
For each region, find the average amount and the number of orders that have an amount, and keep the table as 1 row per region with plain column names.
Open the answer
Named aggregation gives readable column names, and reset_index turns the region back into a normal column. The result is [{'region': 'A', 'avg_amount': 75.0, 'priced_orders': 2}, {'region': 'B', 'avg_amount': 70.0, 'priced_orders': 1}]. Note that the mean of A is 75, not 50: the missing value is skipped in both the sum and the count, so the average is over the two present amounts.
What does reset_index do after groupby?
The group keys become the index of the result. reset_index turns them back into ordinary columns, which is usually what you want before merging, saving or plotting.
Close the lesson and explain it
Without scrolling up, explain the difference between size and count, and what transform adds that agg does not.
Practicals · load into the editor
After you read the theory, run these in the pane on the right. They execute in this tab, no cluster.
Finished this lesson?
Mark it as read when you could explain it to someone else.
Practice this
Same ideas as interview drills. These challenges open in the studio with a dataset and tests already set up.
- GroupBy with Multiple AggregationsInterview-style drill: Per-region totals, average, count, and max amount in pandas.Studiobeginnerpandas12 min
- Share of group and above-group-meanInterview-style drill: Add each order's share of its customer's total and a flag for being above the customer's mean, without collapsing rows.Studiointermediatepandas14 minLocked