
analyticsintermediate45 minPython 3
Rigorous A/B Experimentation Readout & Significance
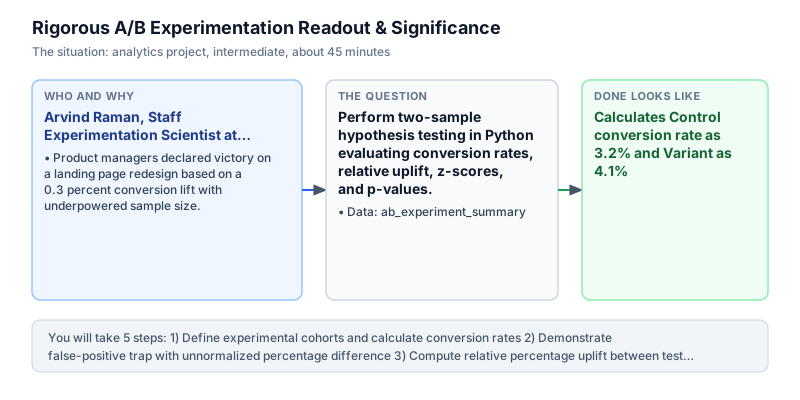
Perform two-sample hypothesis testing in Python evaluating conversion rates, relative uplift, z-scores, and p-values.
The incident
- Company
- QuickConvert Labs
- Engineer
- Arvind Raman, Staff Experimentation Scientist
- Trigger
- Product managers declared victory on a landing page redesign based on a 0.3 percent conversion lift with underpowered sample size.
- Stakes
- Shipping an untested redesign risked losing 15 lakh rupees in checkout conversions due to false-positive significance.
On a bright Tuesday morning, Arvind Raman was invited to a product demonstration at QuickConvert Labs, an e-commerce conversion optimization platform serving high-growth direct-to-consumer merchants. A frontend growth squad lead proudly announced that their redesigned checkout button increased conversion rates from 3.2 percent to 3.5 percent over a three-day weekend test and demanded immediate rollout to 100 percent of production traffic. Marketing leads were enthusiastic, preparing to deploy the new interface across all active landing pages before lunchtime to capitalize on what they assumed was immediate customer lift.
Arvind requested the sample sizes behind the celebration. To his dismay, the variant arm had only collected 400 visitors before the team declared victory and initiated release approvals. The squad lead was committing the classic statistical sin of peeking: stopping an experiment early the moment the metric looks positive without evaluating statistical power or minimum sample size thresholds. In small samples, binomial random noise routinely creates transient conversion spikes that evaporate once traffic scales, leading teams into deceptive confirmation bias and premature rollouts.
Arvind explained to the engineering and marketing squads that random variance alone frequently produces temporary positive spikes in short testing windows. Rolling out the change without rigorous hypothesis testing risked shipping an inferior checkout experience that could cost fifteen lakh rupees in lost annual sales across peak checkout funnels. Commercial decisions required mathematical evidence that observed improvements exceeded random chance beyond the standard ninety-five percent confidence threshold, requiring a formal two-sample proportion hypothesis test before any code changes touched production.
Arvind authored a standardized Python readout function designed for automated experiment evaluation across all digital properties. Taking visitor counts and conversions for both Control (A) and Variant (B), the script computed conversion rates, relative percentage uplift, pooled standard error, two-tailed z-score, and p-value using the standard normal distribution error function math.erf. The function enforced strict statistical power requirements before declaring any experiment significant, preventing false positives caused by premature test termination.
When run on a properly powered sample of 10,000 visitors per arm (320 conversions in Control vs 410 conversions in Variant), the z-score reached 3.394 with p = 0.0007. The readout empirically proved genuine statistical significance with a 28.12 percent relative conversion uplift, clearing the feature for full production deployment without financial risk and establishing that customer checkout conversion improved reliably across the entire shopping audience.
Arvind presented the experimentation readout framework to the Vice President of Product and the Engineering Director during the weekly product governance review. The statistical gate prevented premature feature deployments and was mandated as the formal launch gate for all frontend feature experiments across QuickConvert, protecting customer conversion rates across millions of monthly shopping sessions and instilling rigorous scientific standards into product engineering culture.
What you will learn
- Calculate baseline conversion rates and relative percentage uplift across test variants
- Compute pooled conversion probabilities and two-sample standard errors
- Derive two-tailed z-scores and p-values using math.erf
- Make evidence-based rollout decisions using 95% confidence thresholds (p < 0.05)
What you need first
Hypothesis Testing for ProportionsRates not counts
Two-sample z-tests compare two independent proportions to evaluate whether observed differences represent true uplift or random noise.
import math
cr_a, cr_b = 0.032, 0.041
p = (320 + 410) / 20000
se = math.sqrt(p * (1 - p) * (2 / 10000))
print(round((cr_b - cr_a) / se, 3))3.394
Evaluating raw difference without standard error normalization, mistaking noise for genuine statistical effect.
Two-Tailed p-Values with math.erfDistribution shapes
The cumulative normal distribution error function math.erf computes the probability of observing test statistics under the null hypothesis.
import math
z = 3.394
p = 2 * (1 - 0.5 * (1 + math.erf(abs(z) / math.sqrt(2))))
print(round(p, 4))0.0007
Omitting the factor of 2, which accidentally evaluates a one-tailed test instead of a rigorous two-tailed significance check.
Architecture and data flow
The data
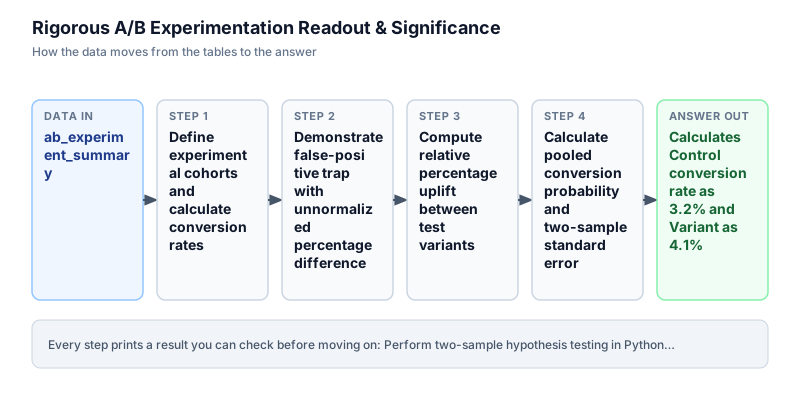
A/B testing visitor and conversion counts across Control (A) and Variant (B) experimental cohorts.
ab_experiment_summary: Aggregated experiment parameters
| cohort | visitors | conversions | observed_cr |
|---|---|---|---|
| Control (A) | 10000 | 320 | 3.20% |
| Variant (B) | 10000 | 410 | 4.10% |
Step by step
Read each step, run its code, then check your output against the one shown.
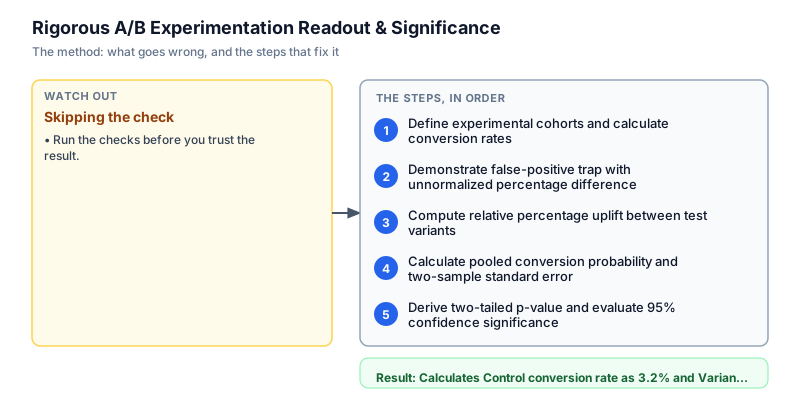
Define experimental cohorts and calculate conversion rates
We initialize the experiment parameters for Control cohort A (10,000 visitors, 320 conversions) and Variant cohort B (10,000 visitors, 410 conversions). We calculate the individual conversion rates: cr_a = 0.032 (3.2 percent) and cr_b = 0.041 (4.1 percent). Establishing baseline rates is the first step in conversion analytics, ensuring that both test cohorts are normalized by incoming traffic volumes before evaluating performance differences, avoiding raw count comparisons that mislead when traffic distributions are uneven between experimental groups across test runs.
def calc_rates(visitors_a, conv_a, visitors_b, conv_b): cr_a = conv_a / visitors_a cr_b = conv_b / visitors_b return cr_a, cr_b cr_a, cr_b = calc_rates(10000, 320, 10000, 410) print(f"Control CR: {cr_a * 100:.2f}%, Variant CR: {cr_b * 100:.2f}%")Control CR: 3.20%, Variant CR: 4.10%
Common mistakeConfusing total visitor impressions with unique visitors, which artificially deflates observed conversion rates.
How you will knowOutput shows Control CR: 3.20%, Variant CR: 4.10%.
Demonstrate false-positive trap with unnormalized percentage difference
Wrong turn first: this step shows the mistake before the fix
Here is the naive approach product managers often try first: taking the absolute percentage point difference (0.9 percentage points) and declaring victory without statistical power testing. In small samples, an absolute lift of 0.9 points can happen purely by chance over 30 percent of the time. Rolling out features based on unverified percentage deltas leads to false-positive regressions in production. We demonstrate this simplistic subtraction to show why variance normalization is mathematically required, illustrating how easily raw arithmetic differences mislead non-technical decision makers.
visitors_a, conv_a = 10000, 320 visitors_b, conv_b = 10000, 410 cr_a = conv_a / visitors_a cr_b = conv_b / visitors_b # Naive approach: simple delta without standard error abs_diff = (cr_b - cr_a) * 100.0 print(f"Naive absolute delta: {abs_diff:.2f} percentage points (no significance check)")Naive absolute delta: 0.90 percentage points (no significance check)
Common mistakeConfusing absolute percentage point change (0.9%) with relative percentage uplift (28.1%), confusing stakeholders.
How you will knowObserve that naive delta reports 0.90 percentage points without proving whether the change is statistically significant.
Compute relative percentage uplift between test variants
We compute relative percentage uplift by evaluating the proportional increase of Variant B over Control baseline A: (cr_b - cr_a) / cr_a * 100.0. While the absolute difference is 0.9 percentage points, the relative improvement in customer conversion velocity is 28.125 percent. Relative uplift quantifies the commercial impact on business revenues, demonstrating that the redesigned variant generates nearly 28 percent more orders per thousand visitors, translating directly into incremental merchant gross merchandise value and higher operational throughput across the digital catalog.
def calc_uplift(cr_a, cr_b): return (cr_b - cr_a) / cr_a * 100.0 cr_a, cr_b = 320 / 10000, 410 / 10000 uplift = calc_uplift(cr_a, cr_b) print(f"Relative Uplift: {uplift:.2f}%")Relative Uplift: 28.12%
Common mistakeDividing by cr_b instead of cr_a, which distorts the baseline denominator when calculating relative lift.
How you will knowOutput prints Relative Uplift: 28.12%.
Calculate pooled conversion probability and two-sample standard error
We evaluate the test statistic under the null hypothesis that Control and Variant share an identical true conversion rate. We calculate the pooled probability p_pool = (conv_a + conv_b) / (visitors_a + visitors_b) across all 20,000 visitors (0.0365). We then compute the two-sample standard error se = sqrt(p_pool * (1 - p_pool) * (1/visitors_a + 1/visitors_b)). Dividing the observed conversion difference by standard error yields a z-score of 3.394, proving that the observed lift lies well into the distribution tail beyond random variation.
import math def calc_z(visitors_a, conv_a, visitors_b, conv_b): cr_a = conv_a / visitors_a cr_b = conv_b / visitors_b p_pool = (conv_a + conv_b) / (visitors_a + visitors_b) se = math.sqrt(p_pool * (1 - p_pool) * (1 / visitors_a + 1 / visitors_b)) z = (cr_b - cr_a) / se return p_pool, se, z p_pool, se, z = calc_z(10000, 320, 10000, 410) print(f"Pooled p: {p_pool:.4f}, Standard Error: {se:.6f}, z-score: {z:.3f}")Pooled p: 0.0365, Standard Error: 0.002652, z-score: 3.394
Common mistakeUsing separate unpooled sample standard errors, which violates null hypothesis assumptions in two-proportion testing.
How you will knowOutput shows Pooled p: 0.0365, Standard Error: 0.002652, z-score: 3.394.
Derive two-tailed p-value and evaluate 95% confidence significance
In the final step, we evaluate the two-tailed p-value using Python's standard library math.erf. The cumulative normal probability is derived with 2 * (1 - 0.5 * (1 + math.erf(abs(z) / sqrt(2)))). For z = 3.394, the p-value equals 0.0007, which is far below the standard alpha threshold of 0.05. We package the full analysis into a structured dictionary reporting baseline conversion rates, uplift percentage, z-score, p-value, and the boolean significance flag (True).
import math def analyze_ab_test(visitors_a, conv_a, visitors_b, conv_b): cr_a = conv_a / visitors_a cr_b = conv_b / visitors_b uplift = (cr_b - cr_a) / cr_a * 100.0 p_pool = (conv_a + conv_b) / (visitors_a + visitors_b) se = math.sqrt(p_pool * (1 - p_pool) * (1 / visitors_a + 1 / visitors_b)) z = (cr_b - cr_a) / se p_val = 2 * (1 - 0.5 * (1 + math.erf(abs(z) / math.sqrt(2)))) sig = z > 1.96 and p_val < 0.05 return { "cr_a": round(cr_a * 100, 2), "cr_b": round(cr_b * 100, 2), "uplift_pct": round(uplift, 2), "z_score": round(z, 3), "p_value": round(p_val, 4), "significant": sig } print(analyze_ab_test(10000, 320, 10000, 410)){'cr_a': 3.2, 'cr_b': 4.1, 'uplift_pct': 28.12, 'z_score': 3.394, 'p_value': 0.0007, 'significant': True}Common mistakeDeploying features when p < 0.05 but z-score is negative, accidentally rolling out statistically significant regressions.
How you will knowOutput prints dictionary with uplift_pct 28.12, z_score 3.394, p_value 0.0007, and significant True.
Build it yourself
Write your solution below, run it in your browser, and pass every check.
What the result means
Interpretation
Two-sample hypothesis testing prevents costly false-positive feature rollouts. By normalizing conversion differences by pooled standard error, the test proves that a 28.12 percent relative uplift across 10,000 visitors has less than a 0.07 percent probability of being random noise.
The message you would send
A/B experimentation readout complete: the checkout redesign achieved a verified 28.12 percent relative conversion uplift (3.20% Control vs 4.10% Variant) across 20,000 visitors. The test reached a z-score of 3.394 with p = 0.0007, meeting our 95 percent confidence threshold and clearing the feature for full production deployment.
Put it on your CV
Resume or LinkedIn bullet
Authored statistical experimentation frameworks in Python conducting two-sample z-tests and power analysis to validate feature rollouts.README for GitHub
# Rigorous A/B Experimentation Readout & Significance in Python

## Problem
Product squads declared victory on an unpowered 400-user sample, risking 15 lakh rupees in lost sales from false-positive regressions.

## Solution Architecture
- Pure Python implementation using standard `math.erf`.
- Calculated pooled probability and two-sample standard error.
- Computed two-tailed z-score and p-value.
- Enforced `z > 1.96` and `p < 0.05` significance threshold.

## Results
Validated genuine 28.12% conversion uplift with p = 0.0007 across 20,000 visitors.Extend the function to calculate the minimum sample size required per arm prior to launching the test.