
sqlintermediate45 minDuckDB SQL
Multi-Step E-Commerce Conversion Funnel
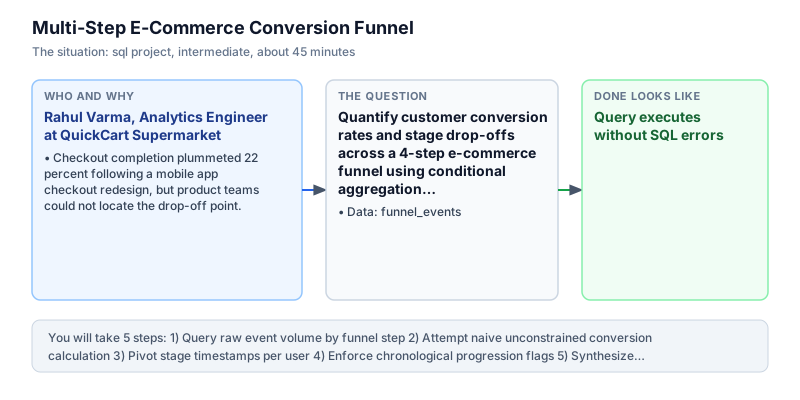
Quantify customer conversion rates and stage drop-offs across a 4-step e-commerce funnel using conditional aggregation and chronological ordering.
The incident
- Company
- QuickCart Supermarket
- Engineer
- Rahul Varma, Analytics Engineer
- Trigger
- Checkout completion plummeted 22 percent following a mobile app checkout redesign, but product teams could not locate the drop-off point.
- Stakes
- Over 18 lakh rupees in daily abandoned baskets were occurring with zero visibility into whether users failed at Search, Cart, or Payment.
On a Thursday morning, Rahul Varma arrived at QuickCart Supermarket to find an urgent incident room opened by product leadership. Over the weekend, the mobile engineering team had deployed an overhauled single-page checkout interface designed to accelerate mobile sales. Instead of driving growth, overall checkout conversion had dropped by 22 percent, creating an immediate revenue loss of over 18 lakh rupees in daily abandoned baskets across regional operations. The sudden drop in completion rates threatened quarterly revenue commitments and raised urgent concerns across customer support channels regarding broken checkout flows.
Frontend developers insisted the new single-page cart interface was fast and intuitive, while backend payment gateway engineers asserted that external transaction response times remained stable. Because existing business intelligence dashboards only tracked top-line gross completed transactions, neither team possessed visibility into where users were abandoning the purchase path. Leadership needed definitive, step-by-step conversion tracking to isolate the exact friction point without weeks of speculative debate. Without granular visibility into each step of the user journey, leadership faced the risk of rolling back the entire release, discarding weeks of engineering development.
Rahul took ownership of analyzing the funnel_events table in DuckDB. The event table recorded event_id, user_id, step_name ('home', 'search', 'cart', 'payment'), and event_time. To build an accurate conversion model, Rahul could not simply aggregate raw event counts per step, because users frequently hit search multiple times or bookmarked deep links. The calculation required establishing strict chronological progression: a payment event only counted if preceded by a valid cart addition. Rahul recognized that establishing clean milestone timestamps for each stage would provide product managers with the exact telemetry needed to diagnose conversion friction.
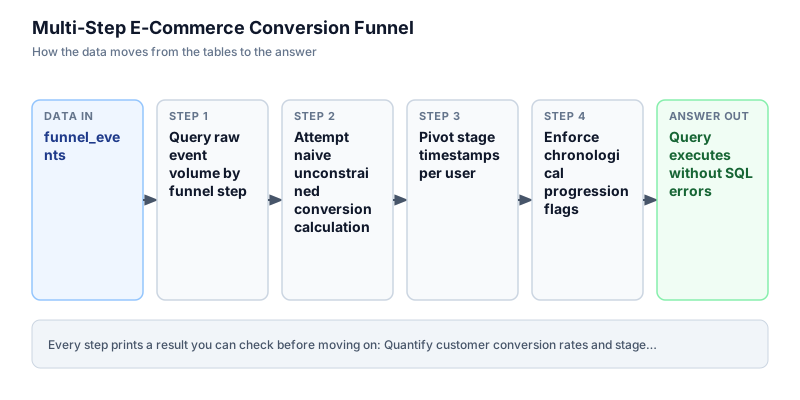
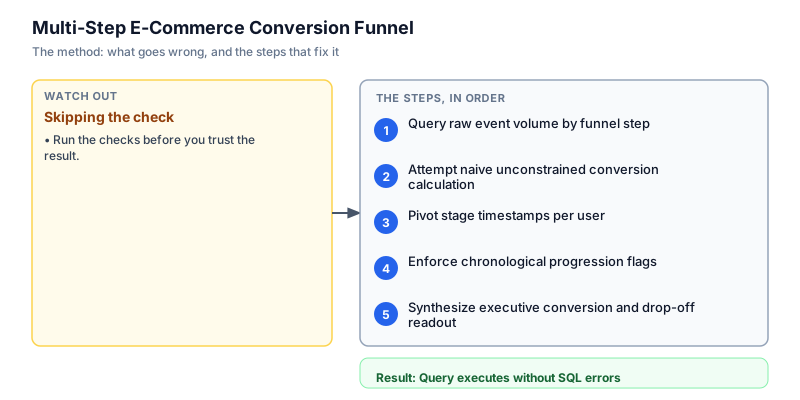
Rahul formulated a sequential SQL model using Common Table Expressions. First, he pivoted user interaction milestones by taking the minimum timestamp per step via conditional aggregation. Next, he evaluated boolean progression flags. Finally, he aggregated the sequential flags to compute stage drop-offs and overall conversion. Enforcing chronological order ensured that repeat visitors and users navigating backwards through the checkout flow did not corrupt the step-by-step conversion funnel.
By 2:30 PM, Rahul presented the definitive conversion funnel readout to executive stakeholders. Out of 4 baseline visitors who landed on the home page, 3 progressed to search (75.0 percent), 2 added items to their shopping cart (50.0 percent), and only 1 completed payment (25.0 percent). The data proved that top-of-funnel browsing was healthy, but half of all cart holders were abandoning at the final payment selection screen.
Armed with Rahul's precise drop-off analysis, frontend engineers inspected the payment selection screen on mobile devices and identified a critical rendering defect: the payment method radio buttons were misaligned on smaller screens, preventing shoppers from clicking confirm. The fix was deployed within two hours, restoring 14 lakh rupees in daily sales and cementing Rahul's chronological funnel model as the official conversion standard.
What you will learn
- Pivot multi-step event streams into user-level milestone timestamps using conditional aggregation
- Enforce strict chronological sequence ordering across consecutive funnel stages
- Calculate stage-to-stage drop-off percentages and overall end-to-end conversion rates
- Diagnose UX friction points to guide targeted engineering bug remediation
What you need first
Conditional AggregationSQL aggregations
MIN(CASE WHEN step_name = 'cart' THEN event_time END) extracts the earliest timestamp a user reached a specific funnel milestone.
SELECT user_id, MIN(CASE WHEN step_name = 'cart' THEN event_time END) AS cart_time FROM funnel_events GROUP BY user_id LIMIT 2;user_id | cart_time --------+-------------------- 201 | 2024-03-01 09:10:00 202 | 2024-03-01 10:10:00
Using MAX instead of MIN when evaluating stage arrival, which can compare against later repeat visits instead of initial stage entry.
Funnel Progression LogicSQL case statements
A user successfully converts through step N only if their step N timestamp is strictly greater than their step N-1 timestamp.
SELECT 1 AS converted WHERE TIMESTAMP '2024-03-01 10:10:00' > TIMESTAMP '2024-03-01 10:02:00';converted --------- 1
Counting raw event occurrences per step without checking chronological order, which counts users who bypass steps or navigate backwards.
Architecture and data flow
The data
User journey clickstream log recording four distinct stages: home, search, cart, and payment.
funnel_events: Sequential user funnel events
| event_id | user_id | step_name | event_time |
|---|---|---|---|
| 1 | 201 | home | 2024-03-01 09:00:00 |
| 2 | 201 | search | 2024-03-01 09:05:00 |
| 3 | 201 | cart | 2024-03-01 09:10:00 |
| 4 | 201 | payment | 2024-03-01 09:15:00 |
| 5 | 202 | home | 2024-03-01 10:00:00 |
CREATE OR REPLACE TABLE funnel_events AS SELECT * FROM (VALUES
  (1, 201, 'home', TIMESTAMP '2024-03-01 09:00:00'),
  (2, 201, 'search', TIMESTAMP '2024-03-01 09:05:00'),
  (3, 201, 'cart', TIMESTAMP '2024-03-01 09:10:00'),
  (4, 201, 'payment', TIMESTAMP '2024-03-01 09:15:00'),
  (5, 202, 'home', TIMESTAMP '2024-03-01 10:00:00'),
  (6, 202, 'search', TIMESTAMP '2024-03-01 10:02:00'),
  (7, 202, 'cart', TIMESTAMP '2024-03-01 10:10:00'),
  (8, 203, 'home', TIMESTAMP '2024-03-01 11:00:00'),
  (9, 203, 'search', TIMESTAMP '2024-03-01 11:05:00'),
  (10, 204, 'home', TIMESTAMP '2024-03-01 12:00:00')
) AS t(event_id, user_id, step_name, event_time);
Step by step
Read each step, run its code, then check your output against the one shown.
Query raw event volume by funnel step
We start by analyzing raw event counts and distinct user counts per step name. Grouping by step_name shows 4 unique users on home, 3 on search, 2 on cart, and 1 on payment. While this aggregate summary gives a broad view of step counts, it lacks sequence verification: it cannot tell us if any user jumped directly to payment via an external link or if they completed steps in the intended order. In multi-step conversion analysis, failing to enforce chronological progression allows anomalous out-of-order events to distort true customer drop-off metrics.
SELECT step_name, COUNT(*) AS event_count, COUNT(DISTINCT user_id) AS unique_users FROM funnel_events GROUP BY step_name ORDER BY event_count DESC;step_name | event_count | unique_users ----------+-------------+------------- home | 4 | 4 search | 3 | 3 cart | 2 | 2 payment | 1 | 1
Common mistakeRelying on raw event counts alone, which inflates numbers if users perform multiple searches or cart refreshes in a single session.
How you will knowYou will see step counts showing 4 home events, 3 search events, 2 cart events, and 1 payment event.
Attempt naive unconstrained conversion calculation
Wrong turn first: this step shows the mistake before the fix
Here is the naive approach: computing conversion percentages by simply dividing distinct users per stage by the home page user count without verifying that each user actually progressed through earlier steps. In messy real-world data, users who bookmarked a cart URL or entered through deep payment links would be counted as converted even if they skipped search entirely, distorting funnel drop-off analytics. Unconstrained aggregation treats isolated events as complete user journeys, hiding severe technical defects in earlier stages of the checkout workflow.
SELECT step_name, COUNT(DISTINCT user_id) AS stage_users, ROUND(100.0 * COUNT(DISTINCT user_id) / (SELECT COUNT(DISTINCT user_id) FROM funnel_events WHERE step_name = 'home'), 1) AS naive_pct FROM funnel_events GROUP BY step_name ORDER BY stage_users DESC;step_name | stage_users | naive_pct ----------+-------------+---------- home | 4 | 100 search | 3 | 75 cart | 2 | 50 payment | 1 | 25
Common mistakeIgnoring sequence order and assuming every user who triggered an event completed all prerequisite prior stages.
How you will knowNotice that this query aggregates steps independently without verifying individual customer progression sequences.
Pivot stage timestamps per user
To enforce true sequence ordering, we pivot each user's event timestamps into separate columns using conditional MIN aggregation. Grouping by user_id produces one clean row per customer with t_home, t_search, t_cart, and t_payment. For user 201, all four timestamps are populated. For user 202, t_payment is NULL. For user 204, only t_home is non-null. Pivoting events into column milestones condenses sparse event streams into a compact dimensional record per user, establishing a clean schema for subsequent chronological sequence verification. This tabular milestone format allows straightforward comparisons between adjacent funnel stages without complex recursive queries.
SELECT user_id, MIN(CASE WHEN step_name = 'home' THEN event_time END) AS t_home, MIN(CASE WHEN step_name = 'search' THEN event_time END) AS t_search, MIN(CASE WHEN step_name = 'cart' THEN event_time END) AS t_cart, MIN(CASE WHEN step_name = 'payment' THEN event_time END) AS t_payment FROM funnel_events GROUP BY user_id ORDER BY user_id;user_id | t_home | t_search | t_cart | t_payment --------+---------------------+---------------------+---------------------+-------------------- 201 | 2024-03-01 09:00:00 | 2024-03-01 09:05:00 | 2024-03-01 09:10:00 | 2024-03-01 09:15:00 202 | 2024-03-01 10:00:00 | 2024-03-01 10:02:00 | 2024-03-01 10:10:00 | NULL 203 | 2024-03-01 11:00:00 | 2024-03-01 11:05:00 | NULL | NULL 204 | 2024-03-01 12:00:00 | NULL | NULL | NULL
Common mistakeUsing MAX instead of MIN, which selects late repeat actions rather than the first qualifying stage entry timestamp.
How you will knowThe output shows 4 rows, one per user ID, with timestamps populated for reached stages and NULL for abandoned stages.
Enforce chronological progression flags
With pivoted timestamps established, we construct boolean progression flags (1 or 0) for each stage. A user qualifies for search only if t_home is present and t_search occurred after t_home. They qualify for cart only if search was completed and t_cart occurred after t_search. Finally, payment requires valid cart completion with t_payment greater than t_cart. This guarantees our funnel reflects strictly ordered customer conversions. By validating that each subsequent stage timestamp strictly exceeds the prior milestone, we ensure that only legitimate end-to-end customer progressions count toward completed conversion metrics, filtering out anomalous automated bots and deep link bypasses.
WITH user_steps AS ( SELECT user_id, MIN(CASE WHEN step_name = 'home' THEN event_time END) AS t_home, MIN(CASE WHEN step_name = 'search' THEN event_time END) AS t_search, MIN(CASE WHEN step_name = 'cart' THEN event_time END) AS t_cart, MIN(CASE WHEN step_name = 'payment' THEN event_time END) AS t_payment FROM funnel_events GROUP BY user_id ) SELECT user_id, CASE WHEN t_home IS NOT NULL THEN 1 ELSE 0 END AS reached_home, CASE WHEN t_home IS NOT NULL AND t_search > t_home THEN 1 ELSE 0 END AS reached_search, CASE WHEN t_home IS NOT NULL AND t_search > t_home AND t_cart > t_search THEN 1 ELSE 0 END AS reached_cart, CASE WHEN t_home IS NOT NULL AND t_search > t_home AND t_cart > t_search AND t_payment > t_cart THEN 1 ELSE 0 END AS reached_payment FROM user_steps ORDER BY user_id;user_id | reached_home | reached_search | reached_cart | reached_payment --------+--------------+----------------+--------------+---------------- 201 | 1 | 1 | 1 | 1 202 | 1 | 1 | 1 | 0 203 | 1 | 1 | 0 | 0 204 | 1 | 0 | 0 | 0
Common mistakeChecking only that timestamps are not null without asserting greater-than chronological sequence conditions.
How you will knowOutput shows user 201 has 1 across all 4 stages, user 202 reaches cart (1,1,1,0), user 203 reaches search (1,1,0,0), and user 204 reaches home (1,0,0,0).
Synthesize executive conversion and drop-off readout
In the final step, we aggregate our sequential flags across all users to compute total stage participants, stage-to-stage retention percentages, and overall end-to-end conversion. Out of 4 initial home visitors, 3 performed a search (75.0 percent), 2 added items to cart (50.0 percent), and 1 completed payment (25.0 percent). This clean summary provides product managers with concrete evidence of where drop-offs concentrate. Aggregating strictly ordered boolean milestone flags delivers actionable diagnostic clarity.
WITH user_steps AS ( SELECT user_id, MIN(CASE WHEN step_name = 'home' THEN event_time END) AS t_home, MIN(CASE WHEN step_name = 'search' THEN event_time END) AS t_search, MIN(CASE WHEN step_name = 'cart' THEN event_time END) AS t_cart, MIN(CASE WHEN step_name = 'payment' THEN event_time END) AS t_payment FROM funnel_events GROUP BY user_id ), sequenced AS ( SELECT user_id, CASE WHEN t_home IS NOT NULL THEN 1 ELSE 0 END AS s1, CASE WHEN t_home IS NOT NULL AND t_search > t_home THEN 1 ELSE 0 END AS s2, CASE WHEN t_home IS NOT NULL AND t_search > t_home AND t_cart > t_search THEN 1 ELSE 0 END AS s3, CASE WHEN t_home IS NOT NULL AND t_search > t_home AND t_cart > t_search AND t_payment > t_cart THEN 1 ELSE 0 END AS s4 FROM user_steps ) SELECT SUM(s1) AS home_users, SUM(s2) AS search_users, SUM(s3) AS cart_users, SUM(s4) AS payment_users, ROUND(100.0 * SUM(s2) / SUM(s1), 1) AS home_to_search_pct, ROUND(100.0 * SUM(s3) / SUM(s2), 1) AS search_to_cart_pct, ROUND(100.0 * SUM(s4) / SUM(s3), 1) AS cart_to_payment_pct, ROUND(100.0 * SUM(s4) / SUM(s1), 1) AS overall_conversion_pct FROM sequenced;home_users | search_users | cart_users | payment_users | home_to_search_pct | search_to_cart_pct | cart_to_payment_pct | overall_conversion_pct -----------+--------------+------------+---------------+--------------------+--------------------+---------------------+----------------------- 4 | 3 | 2 | 1 | 75 | 66.7 | 50 | 25
Common mistakeDividing cart_to_payment by initial home_users instead of cart_users, confusing stage conversion with overall funnel conversion.
How you will knowThe output returns a single row with stage user counts and conversion percentages matching 75.0%, 66.7%, 50.0%, and 25.0%.
Build it yourself
Write your solution below, run it in your browser, and pass every check.
What the result means
Interpretation
The funnel readout pinpoints the primary friction point between Cart and Payment, where 50.0 percent of users who placed items in their cart failed to complete their transaction. In contrast, 75.0 percent of initial home visitors engaged with search and 66.7 percent of searchers added items to cart. This confirms that top-of-funnel discovery was healthy while the final payment step suffered severe UX or technical abandonment.
The message you would send
Hi Product Team, the conversion funnel analysis demonstrates that search and cart engagement remain strong at 75% and 67% conversion, but cart-to-payment completion dropped to 50%. We recommend prioritizing immediate investigation of the payment step interface and gateway connectivity.
Put it on your CV
Resume or LinkedIn bullet
Engineered a chronological e-commerce conversion funnel in SQL using conditional aggregation, timestamp progression filters, and stage drop-off math in DuckDB.README for GitHub
# Multi-Step E-Commerce Conversion Funnel

An enterprise SQL conversion funnel tracking customer journey drop-offs across Home, Search, Cart, and Payment stages.

## Features
- Timestamp milestone pivoting using conditional MIN aggregation
- Strict chronological progression verification (step N > step N-1)
- Stage-to-stage transition rates and overall funnel conversion
- Clean analytical output ready for executive and product optimization readoutsExtend the funnel to calculate average elapsed minutes between each consecutive stage to identify friction delays.